
Customer journey mapping: your key tool for informed business decisions
Your website exists to serve customers. It lets them engage with you, purchase your products or services, and find answers to any company-related questions.
In order to design your website in the best possible way, you want to understand how your customers think and how they want to navigate the site.
That’s where customer journey mapping plays a key role.
Read on to learn:
- What customer journey mapping is
- Why it is important
- The difference between customer journey mapping and customer experience mapping
- The basics of creating customer journey maps
- How to combine customer journey mapping with analytics
- How to improve the customer journey using heatmaps and A/B tests
What is customer journey mapping?
As its name suggests, customer journey mapping is the process of creating a visualization of the path customers take when engaging with your company or brand.
This is called the customer journey map, and it shows all the different points of interaction between you and the customer. Mapping a customer journey lets you see things from your customers’ point of view. It does so by identifying their needs, motivations, actions, and frustrations at every step of dealing with your brand.
You can map a customer journey using something as basic as an Excel sheet, but some companies rely on dedicated software to create more elaborate diagrams and tables.
In the broadest sense, customer journey mapping helps visualize the entire customer lifecycle, which can include:
- First hearing about your brand
- Researching your products
- Visiting your site
- Comparison shopping
- Making a purchase
- Receiving a product
- Contacting support for help
- Making a repeat purchase
- …and so on
Such a broad approach will map every single touchpoint, whether it takes place in person, on social media, on a website, or via a phone call to customer service.
But you can also use customer journey mapping for smaller, self-contained parts of the process. It’s entirely possible to create a customer journey map focused on just the shopping experience in one of your stores or your website.
At the same time, even a single website can actually involve multiple customer journeys. Some visitors are there to buy a product, some need to find support, and others are looking to become your business partner. Each of them will go through a separate customer journey to get there.
The rest of this article will primarily focus on customer journey mapping for your website.
Why customer journey maps are important
A customer journey map is more than just a pretty chart. It’s a framework to identify issues, improve your site navigation, and design a better user experience.
Here are just a few ways in which customer journey mapping helps your business.
Spot drop-off points and navigation issues
The most direct outcome of a thoroughly mapped customer journey is that you’re able to quickly see exactly where site visitors run into unforeseen problems on your site.
Is the visitor repeatedly clicking on multiple footer links in an attempt to find a specific file? Do potential customers tend to quit your checkout process halfway through because you don’t offer the right credit card payment options?
Customer journey maps help you uncover such drop-off points and confusing internal links. And knowing is half the battle. Once you’ve identified the weak areas of your site, you’re able to fix them.
Evaluate your brand and offers
Mapping your customer journey also gives you valuable insights about your brand, content, and offers. In turn, this makes you better able to tailor them to the right visitors.
For instance, imagine that you’ve designed your pricing page to nudge people into signing up for your “Premium” plan. But after mapping your customer journey, you discover that most people instead use that page to start the free 10-day trial included in your “Basic” plan. You might want to restructure the page to put the “Free Trial” offer in focus, with the opportunity to upgrade to the “Premium” plan once it expires.
Similarly, you can identify which products in your inventory get the most clicks or what type of content visitors frequently search for. You can then organize your site to feature these products and content more prominently, making them easier to access.
Uncover true customer intent
More broadly, customer journey mapping can help you better understand why your customers visit your site in the first place. This makes it possible to address any misalignment.
Say you’ve designed your front page to prominently feature your best products, hoping that you’ll sell more of them online. However, after analyzing the customer journey, you find that website visitors are usually there just to download the latest firmware. Maybe most of them prefer to buy your products in physical stores, so they treat your website only as an after-sales service portal.
Knowing your customers’ underlying intent can help you better align the site with that intent. In our example, you might redesign the front page to clearly list the latest firmware files and install a chat widget that lets customers talk to support agents in real time.
Improve customer satisfaction and retention
The end result of fixing your site and restructuring it to align with visitor intent? You’ll give your customers a better, more stress-free experience. Instead of trying to force your internal business priorities on the visitors, customer journey mapping helps you respond to their actual expectations.
Listening to your visitors in this way will keep them happy and help you retain your existing customers. After all, they’re far more likely to stay with a business that takes their needs into account.
Increase key goals and conversions
On the flip side, customer journey mapping also benefits your business. If you know which offers are popular and which actions people intend to take, you can design the whole site experience around them.
Displaying the right content at the right time makes people a lot more likely to engage with it. This leads directly to increased on-site engagement, reduced bounce rate, higher conversions, and improvements in other key business metrics.
What are touchpoints, entry points and exit points in customer journey mapping?
To understand the process of mapping your customer journey, you’ll have to be familiar with the following basic terms.
Touchpoints
This describes any interaction taking place between you and your customer.
In general terms, it could be an email the customer receives, a phone call with support, seeing your product banner in a store, and so on.
When it comes to your website, a touchpoint is any action your customer takes to engage with your site content: clicking on a call-to-action button, downloading a file, or signing up for your newsletter.
Understanding the different touchpoints and their relative importance for your customers helps you optimize the on-site experience around them.
Entry points
This is the first point of contact a customer has with your site. In most cases, this will be the page on which the customer first lands when arriving to the site.
Sometimes, an entry point will in itself tell you a lot about what the customer is there to do.
For instance, if a visitor lands on your front page, you usually won’t know their exact intent until they go through additional touchpoints (unless your entire site is optimized toward a single, specific offer).
But if someone lands directly on an individual product page, you can be reasonably sure they’re interested in either buying or at least learning more about that product. They might have clicked your product ad on Facebook or searched for your product on Google.
Optimizing effectively for the different entry points is a big part of working with customer journey maps.
Exit points
An exit point marks the end of a customer’s journey on your site. Usually, it signals one of two opposing outcomes:
- The customer found what they were looking for and successfully completed their intended journey (e.g., bought a product, signed up for a service, read the FAQ section they needed, and so on).
- The customer gave up, possibly because your site didn’t have the content they needed or they couldn’t find it due to poor navigation.
The goal of working with customer journeys is to first identify such exit points. Then you can make sure you’re optimizing toward the first outcome and minimizing the second one.
Differences between customer journey mapping and user experience mapping
On the surface, these concepts are quite similar. They both have to do with trying to map out and understand user behavior on your site. But there’s a subtle difference.
Customer journey mapping focuses primarily on directly observable, deliberate interactions taking place on your site. You can usually clearly identify these, track them in your analytics tools, and optimize your site for them.
Customer experience mapping, on the other hand, has the goal of understanding your customers’ frame of mind during these interactions. You’re looking at the journey from their point of view.
For instance, they’re likely to be excited when browsing your webshop because they’re looking forward to the purchase. On the other hand, they’re probably upset or stressed when visiting your “Troubleshooting” page because their product isn’t working.
You’ll want to adjust your site elements to reflect these different scenarios, from the tone of voice you use to the visuals you pick.
Mapping the customer experience is a bit more tricky. It requires a great deal of empathy and an understanding of human psychology. But it’s a critical component of designing customer journeys that put your visitors first.
Customer journey mapping: The basics
You’ve now learned why it’s a good idea to map out your customer journey.
Here’s how you can start this process.
Learn where users come from
The first step is to find out what drives customers to your site. This will define how many separate customer journeys you’re dealing with.
In a simple case, your site sells a single subscription and all of your traffic comes from paid Google ads. You control exactly what the customers see when they click on your ad (your ad copy), what their entry point is (your landing page), and what the ideal exit point should be (signing up for your paid monthly service).
In complex cases, your customers might come from multiple marketing channels, enter your site via hundreds of different pages, and have very different user needs. Optimizing for these will require you to map out a number of journeys that reflect the user intent and the channels that brought them in.
Define the user goals
Now that you know where your customers come from, you’ll need to define their expected goals.
Someone entering the FAQ section via your Facebook page is likely looking for help. Finding the right answer is their primary goal, so that’s what you should optimize the journey for.
During this process, it often helps to apply the AIDA marketing model to understand which stage your customers are in:
- Awareness: They’re vaguely familiar with / have heard of your brand or products.
- Interest: They want to learn more about your offers and compare them to alternatives.
- Desire: They’re interested in your product or offer.
- Action: They’re ready to act by purchasing a product or signing up.
Defining the expected AIDA stage for each entry point will determine the goals you set and the journey you’ll be designing for.
Understand the user intent
As you’ve already seen, uncovering the user intent behind the visit helps you tailor the site toward it.
Remember: not every goal has to be a sale or a conversion of some kind. You can optimize for things like time on site, views of a certain video, clicks to key pages, and more. This is especially true during the “awareness” and “interest” stages where you want to encourage people to stay on your site and learn more about your brand.
It’s equally important to consider what marketing campaigns or search terms have brought the users to your site. These are additional indicators of user intent.
For instance, two people entering the same product page may well have completely different needs. Someone typing “does [product] have [feature]” calls for a separate approach from someone looking for a “discount code for [product].”
Create the optimal path
Armed with the understanding of your marketing channels, your visitors, and their goals, you’re in a position to design the user journey that best caters to these.
For each customer journey, create the optimal path that gets the users to their end goal with as little friction as possible. They should be able to find the page they need quickly, navigate to it with just a few clicks, and complete their task without getting confused.
At this stage, it often helps to tap into any customer research available to you. You’ll want to gather insights about each user segment, their expectations, and their preferred way of navigating the site.
If you’re short on this kind of data, a good place to start is by conducting a few qualitative interviews to test your assumptions about the optimal user journey.
Test your customer journey
No matter how happy you are with the conceptual design of your site, you must always put it to the test. The only way to find out if your customer journey works as expected is to actually experience it.
You can approach this testing in two steps.
First, test the journey yourself. Pretend to be the customer with a specific goal, and start the journey at the entry point they’ll be coming through. See how easy it is to find the key elements on the landing page that take you to the next step. Are they clearly visible? Does the descriptive text explain them well enough? Can you easily engage with them?
If you run into any vague wording or hard-to-find links, fix them. But remember: This is your site and you already know it well. That means you may miss some obvious pitfalls because you intuitively know where to click and what to look for.
The second approach to testing the customer journey is more robust. It’s called user testing and relies on random people who haven’t seen your site before.
The way it usually works is that you give these users a few specific tasks to complete on your site. You tell them what they want to do but not how to do it or which links to click to get there. Then you observe how they go about completing the given tasks and note any points of confusion or frustration. You’ll often discover that what you thought was a self-explanatory button isn’t at all clear to new users, or that they get sidetracked by links that have nothing to do with your intended user journey.
You can conduct this kind of user testing in person and literally look over someone’s shoulder as they try to perform the tasks. Alternatively, there are third-party tools focused on user testing. You tell them the site you want tested, provide a list of tasks or a script, and specify any preferences about the kinds of users you’re looking for. They then get real people around the world to go through your site and try to complete the tasks, noting any broken paths or confusing navigation.
This type of testing will help you identify and address site architecture issues that stand in the way of the perfect user journey.
Track and improve
Creating a customer journey map isn’t a one-off task. Your users and their needs are constantly evolving.
So even after you’ve designed and published the optimal site structure, it’s important to keep an eye on your site performance to see how users interact with it. This will let you spot new issues or act on potential opportunities to increase conversions.
As you’re about to see, there are several tools that can help you with this.
![]()
Combining user journey mapping with web analytics
The best way to make sure you continue serving your customers’ needs at all times is to integrate your website analytics tool into the process.
These analytics tools will give you an aggregate view of what happens on your site, letting you spot common drop-off points or underperforming conversion pages.
For each predefined customer segment, you’ll be able to observe their path through your intended funnel and determine if a high proportion of them completes the ideal journey. You’ll also be able to monitor non-conversion metrics like the time spent on site, pages viewed per visit, bounce rate, and so on.
Having this top-level overview helps you zoom in on areas where you might need to rethink the user journey.
For instance, if you notice that only 10% of visitors to your support page actually find the critical FAQ section, you’ll want to revisit that path again. You might do another round of user testing to see what makes the FAQs hard to find, and then fix any navigation issues or broken links.
But as useful as web analytics reports are, they usually can’t tell you what happens on a page-by-page basis. For that, you have heatmaps.
Optimizing your ideal customer journey with heatmaps
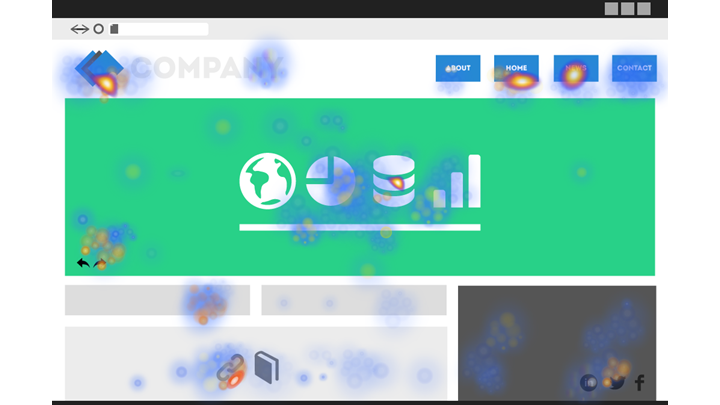
Heatmaps help you understand how users engage with individual pages and on-page elements.
In short, a heatmap is a color-coded overlay mapped over a specific page. It turns numerical data points into distinct colors. Typically, page areas that don’t get much attention will be painted in “cold” colors like blue, while areas of high activity will get a “hot” red color. The end result is a highly visual representation of abstract data that helps you immediately understand it at a glance.
There are three common types of heatmaps:
Scroll maps
This shows you the percentage of users that scroll down to the lower sections of your page. You’ll usually start with a red “above-the-fold” area that everyone sees when they load the page, and this will quickly turn blue toward the bottom as users drop off.
Scroll maps are relevant for deciding where to place key page sections. If only 10% of your users ever scroll to the very bottom of a support page, you probably don’t want to put the main FAQ section there. You can rearrange the page so that the FAQ section starts close to the top, where at least 70% of users see it right away.
Click maps
Click maps show the amount of clicks each page element gets. Again, elements with no clicks will be blue, while elements that get a lot of clicks will be red.
This is useful for two reasons.
One, you can easily tell whether your intended primary call-to-action buttons or navigation elements actually get clicked.
Two, it can help you spot distractions. Say you have a banner image that’s only there for design purposes. If a click map shows many people trying to click it, that banner is currently distracting them from what they’re actually there to do.
You can choose to either remove the banner or, if relevant, actually make it clickable and link it to the natural next step.
Move maps
Move maps are similar to click maps, but they track where the person’s cursor is on a page at any given time, rather than where they click.
Since cursor placement is often an indicator of where people might be looking, it gives you a sense of which visual elements attract attention. You can use this insight to better arrange such elements to guide users towards their end goal.
As you can see, all three types of heatmaps can be useful in understanding and redesigning your customer journey.
Using A/B testing and multivariate testing to improve customer journey maps
While analytics and heatmaps tell you how your existing customer journey performs, A/B testing lets you test new, alternative versions of it.
In an A/B test, you split your incoming site traffic into two separate groups. Each of these groups will see a different version of your site (the split is usually 50%/50%, but you can customize this).
Group A will continue to see your site as it is right now. Group B, on the other hand, will see a “challenger” version that you expect to perform better. The change in this version could be as little as a specific button having a different color or as big as a complete site redesign.
For each group, you’ll continue to track key goals and conversions. This will let you objectively evaluate which version is best at achieving its intended goals. Then you’ll update your site to use the better-performing variant. After that, you can test that chosen variant against a new challenger, so the A/B testing process may continue indefinitely.
Multivariate testing is somewhat similar to A/B testing. Instead of serving two predefined versions of the site, it lets you create multiple variations of a few page elements. It will then mix these and serve them at random to subsets of your visitors to see which combination of tweaks works best.
A/B testing is a great tool for trying to fix broken customer journeys or improve existing ones.
To stay with the FAQ example from before, you could start with a hypothesis that moving the FAQ section to the top of the page will make more people find and click on it. You would then create a “B” version of the page with the FAQ section at the top and launch the test. After a while, you’ll be able to measure if more people in the “B” group are clicking on the FAQ elements and reading the relevant section.
If they are, you’ve successfully improved the customer journey! Launch the “B” version.
If they’re not, then perhaps the placement of the FAQ section is not the problem. Come up with a new hypothesis and put it through a new A/B test.
By continuously A/B testing new versions of the site, you’ll be making your customer journey more intuitive on an ongoing basis.
Customer journey mapping with Siteimprove Analytics
The process of creating and improving customer journey maps typically requires the use of multiple analytics tools.
But what if you could have an all-in-one tool that covers the entire process? That’s exactly what Siteimprove Analytics is designed to do. It delivers actionable insights that help you design, track, and continuously improve your customer journeys.
Siteimprove Analytics assists you in several key areas.
Easy customer journey mapping
Map out your user journey directly in the tool. Set up key conversion metrics to make them easy to monitor and report on.
Realtime data on user journeys
Get a live view of how customers navigate your site from point A to point B. Check if your customer journey works as planned or if it needs further improvement.
Integrated web analytics
Monitor key metrics via top-level reports. Identify underperforming journeys to help you prioritize optimization activities.
Heatmaps and behavior maps
Turn your data into a visual, at-a-glance view of customer behavior. Eliminate distractions and design a better on-site experience.
Integrations with marketing automation tools
Siteimprove Analytics works out of the box with your existing marketing automation setup. Feed key data to your third-party marketing tools to make them more effective.